Currently, how much food waste has increased around the world? At what rate have the world’s forests’ been reduced? Graphs and charts are often used to help us visualize, and hence comprehend the situation of social issues.
Unfortunately, no matter how clear or precise these information may be, they do not catch the attention of people who have little or no interest in what is going on in the world. Therefore many NGOs and NPOs working in the forefront have this common concern.
Beautifying boring data with art
The CHART project is a unique project attempting to solve this obstacle with the power of “art”. It is headed by the PR company Hitoshizuku Inc. that immerses in activities that aim on improving the common social good.
The CHART project leaves only the line of graphs and charts of data used to convey social issues, such as environmental disasters or food waste. Next, the project renders this information into works of art by creating paintings or three dimensional works.
By transforming it into a familiar art piece, anyone can now easily visualize, touch, decorate, carry around and share data related to social issues. The main purpose of this project is to illicit opportunities for people who struggle to find their relevance to social problems to think about and open their minds to what is currently occuring in our world.
Some examples from the CHART project
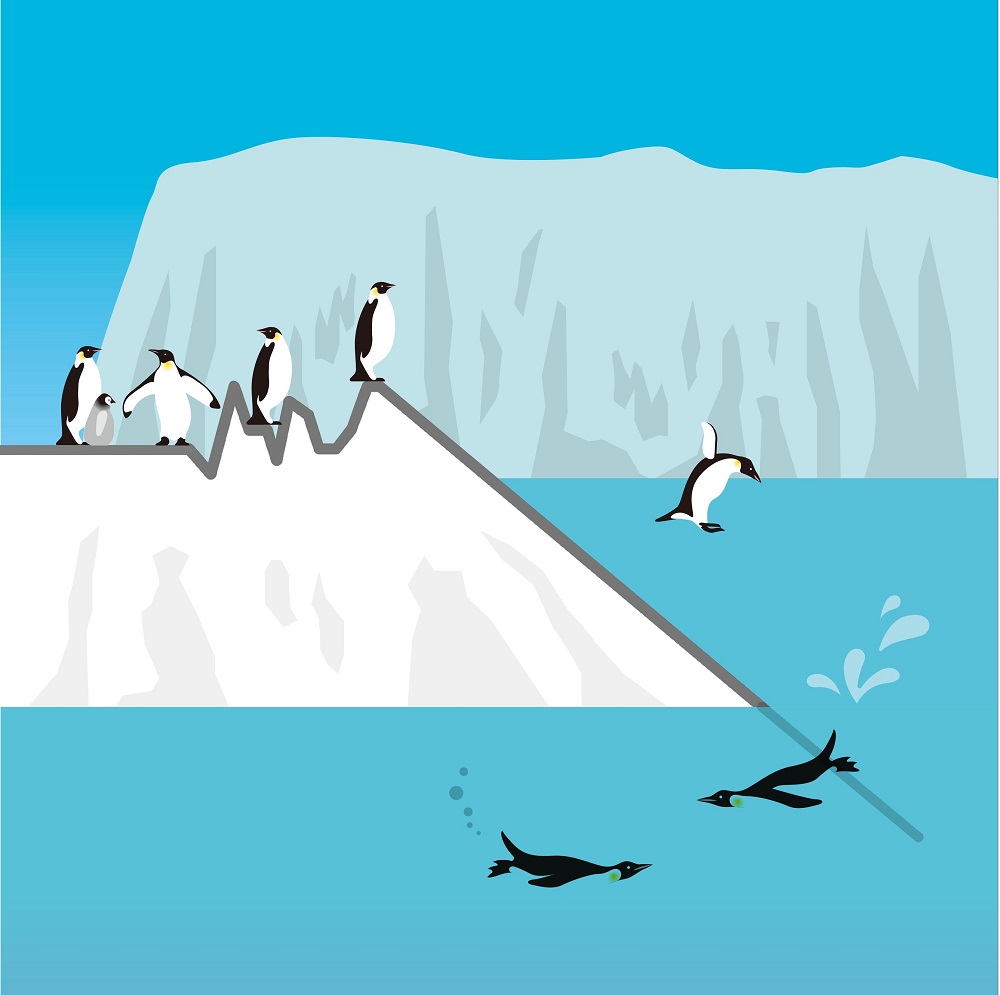
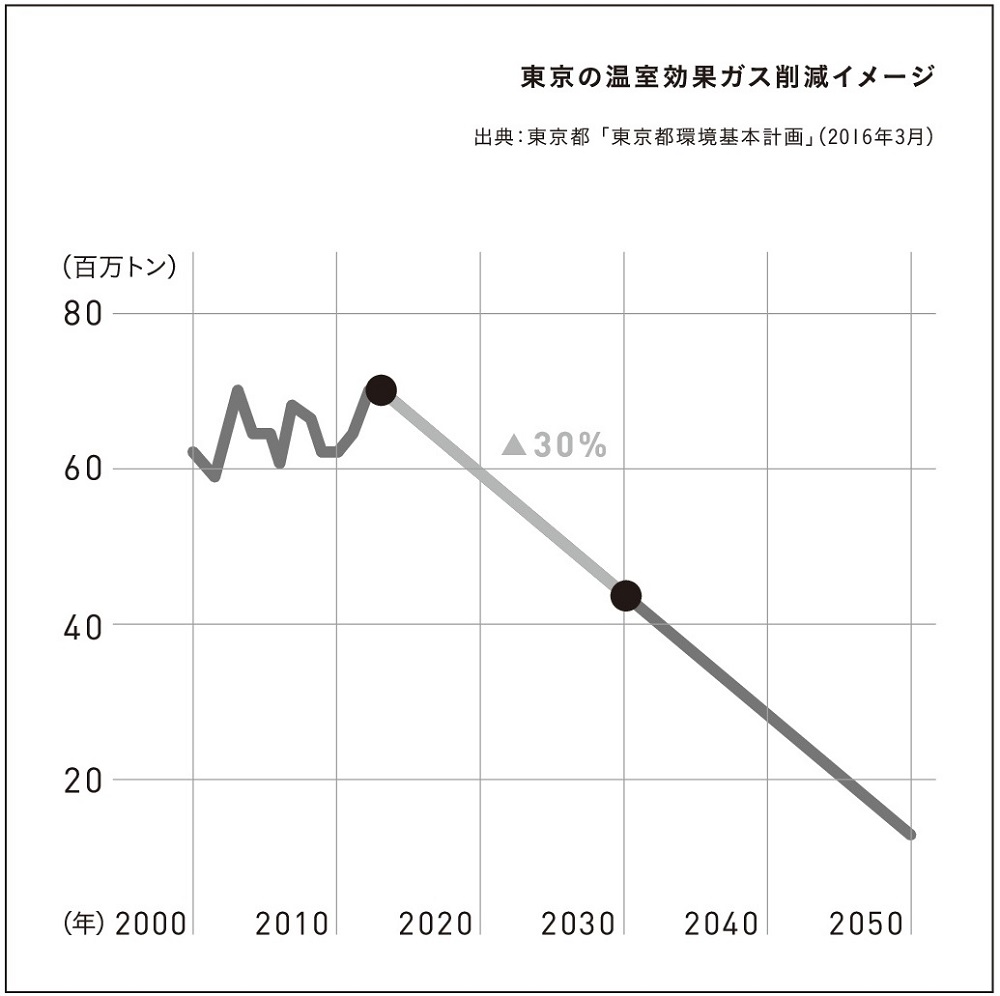
For example in the artwork below is a picture of penguins diving and enjoying themselves. Underlying it is an image that focused on Tokyo’s goal of curtailing the effect of greenhouse gases. The art provokes us to think about preventing global warming in order to protect their playground.
The next illustration is drawn by Kawasaki Shunichi, a picture book and animal writer. He depicts an image of the rare Japanese Murrelet bird that inhabits Kaminoseki, in Yamaguchi. Because of a scheduled building of a new nuclear reactor, there is now a danger of the loss of many plant and animal species in the area.
Among the 252 rare species within this town, the proportion of organisms living at the planned nuclear site have climbed to over 60%, and this chart was drawn as a concept to deliver this sort of information.
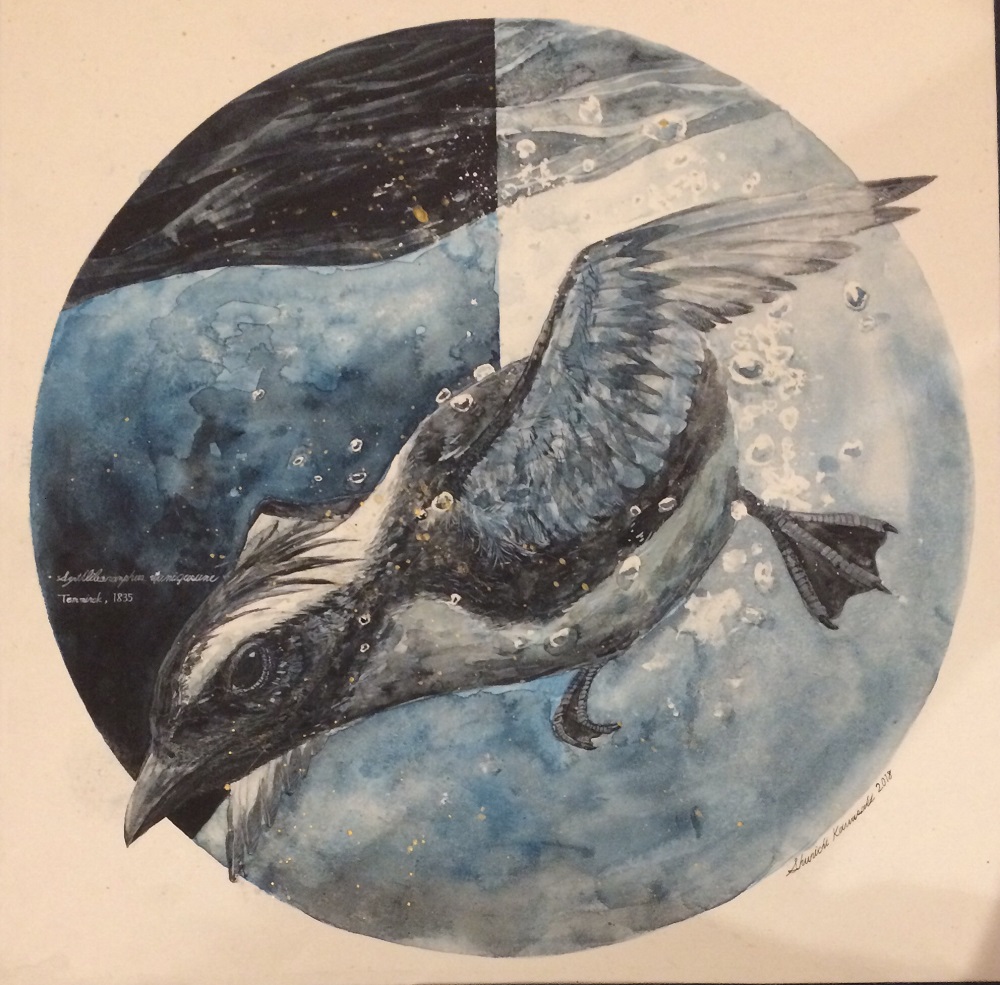
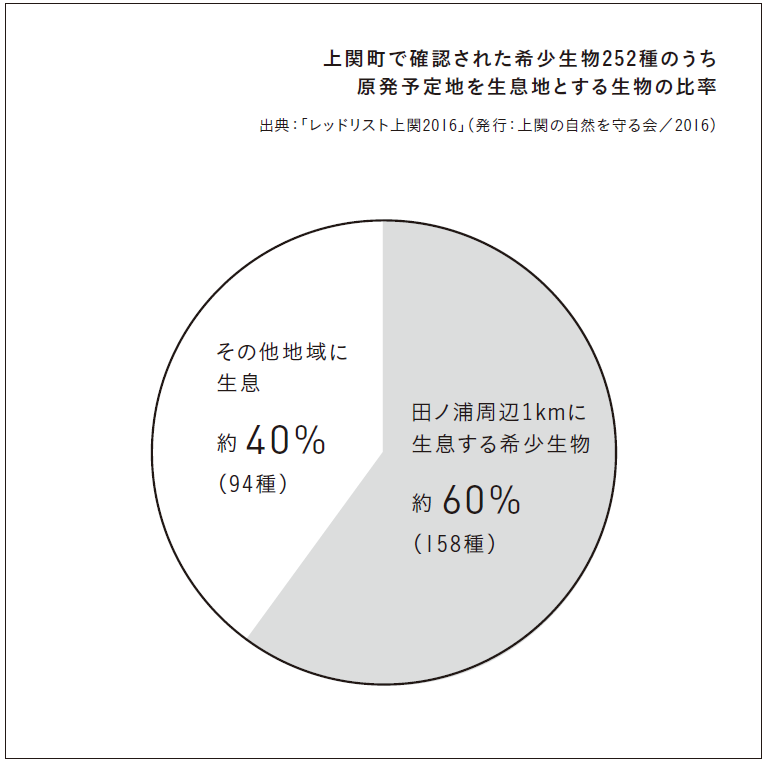
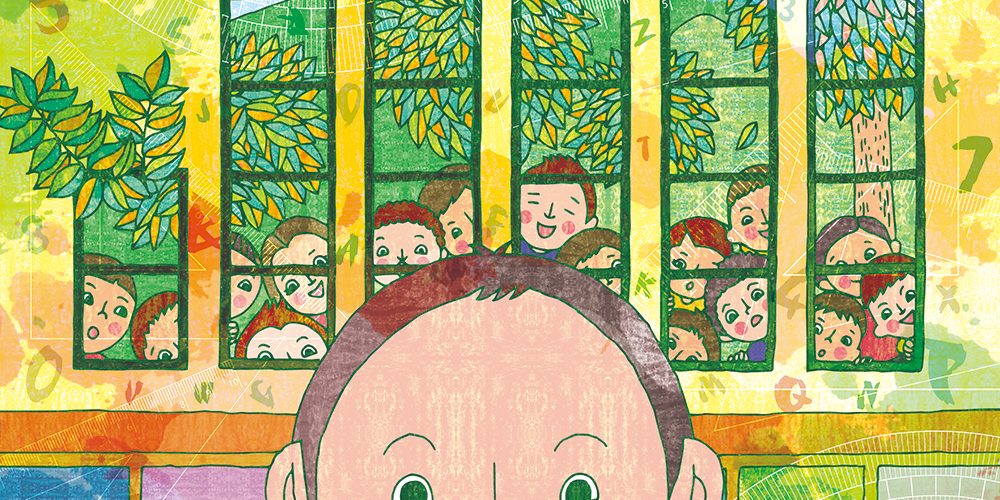
Illustration and picture book creator, Aurinco, uses graphs to show the proportion of children in developing countries (such as Thailand, Nepal, Myanmar and Laos) who still lack access to middle school education. In the next illustration, we see a child reading a book while children outside the windows look on with envy. The illustration reveals the secret that a simple thing such as reading a book is not an everyday privilege for many people.
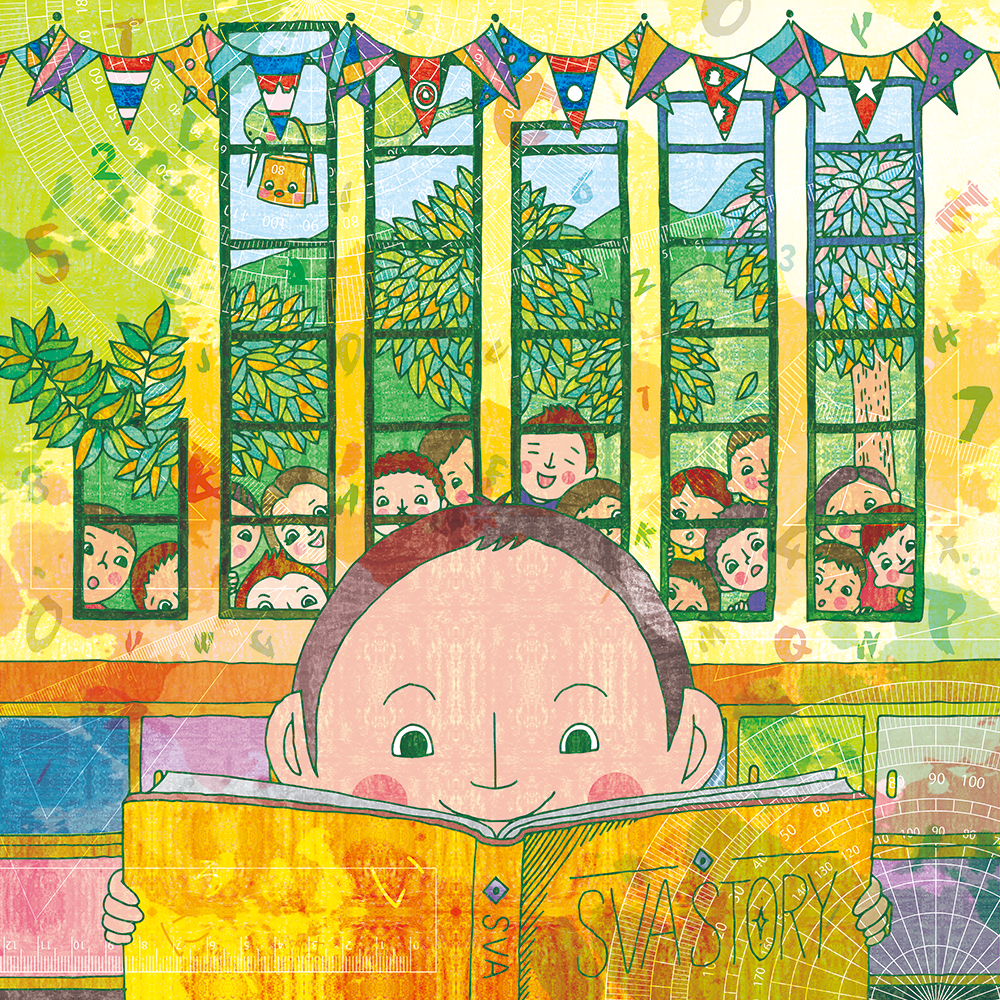
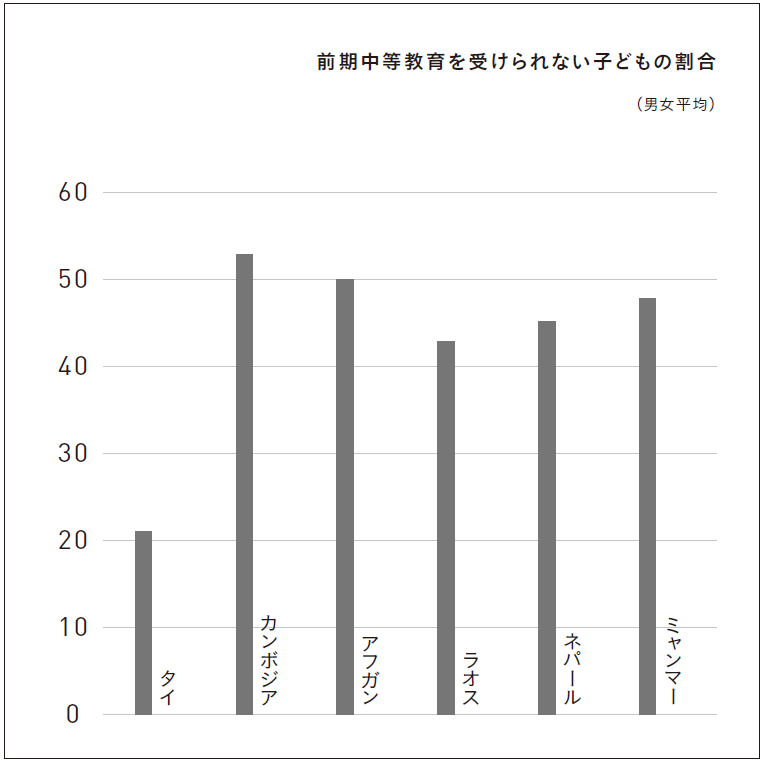
CHART project’s 4S policy
The CHART policy has started a 4S policy that are Social issue, Square, Secret, and Share.
Among them, the “Secret” rule has the strongest embodiment in the CHART project. At first glance, works of art first come off purely as something fun to admire, so most people do not identify the data hidden in each art work.
However, it is only after some observation that a specific societal problem begins to reveal itself, and thus conveyed to the viewer. This realization will help leave an impression on its viewers and aid in raising awareness related to social issues.
The CHART project wants to convey these messages with subtlety. A new form of communication can spread knowledge about the problems we face today. Consequently, we’d be able to connect the general public with issues in society through media that we call art.
In addition, it is essential for the illustrations to hold a creative commons license for the “Share” policy. This will subsequently allow anyone to freely create and share work, as long as it is not for profit.

Creating beautiful data alone is not enough to create awareness
In the future, the CHART project plans to hold exhibitions at home and abroad of collected CHART works. It also wants to collaborate with various companies and organizations. The group is also looking to gather fellow “CHARTists” who understand their philosophy and are willing to produce art work.
The CHART project hopes to convey closeness and positiveness, while also urging viewers to take action in finding solutions to social issues. It has also inspired us to think how we can contribute and act for a better society.
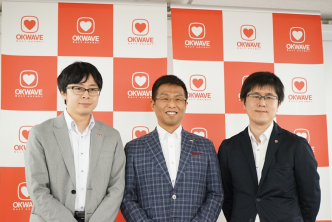
Hiroshi Kokubo, the CEO of Hitoshizuku, the company in charge of the CHART project, shares his thoughts on this fresh endeavor.
“Even if it’s only a small amount, if I can support those who have a burning passion for drawing, traveling, creating places, fashion an appreciation for art, and would like to make the world a better place through “love and care, then it would make me incredibly happy.”
[Reference Site] Hitoshizuku Inc. [Reference Site] I would also like to launch a “CHART project” that transforms social data into artwork [Reference Site] Instagram CHART projectThis article was originally published on IDEAS FOR GOOD.
Translated by Maurice Skinner.